Monitor chatbot usage
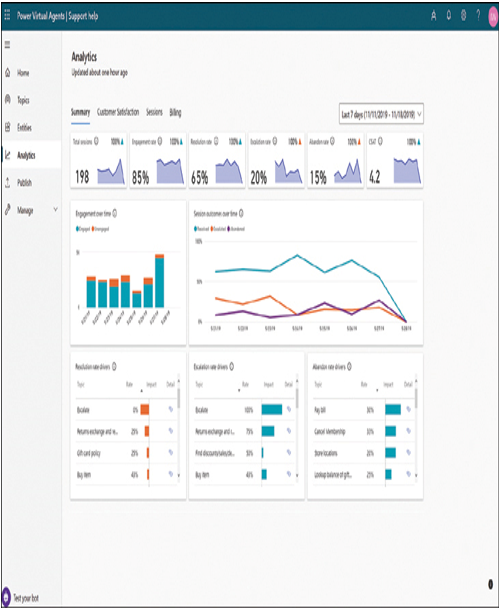
The Analytics page in the Power Virtual Agents portal, shown in Figure 6-24, provides an array of charts that allow developers and administrators to track the number of users that access a bot and examine the results of that usage.

FIGURE 6-24 The Analytics page in the Power Virtual Agents portal
The top row of small area charts provides the following statistics for the range of dates specified in the selector:
■ Total sessions—Specifies the number of bot sessions that took place
■ Engagement rate—Specifies the number of bot sessions in which the user’s topic was found or the session was escalated
■ Resolution rate—Specifies the number of bot sessions in which the user responded positively to a customer satisfaction survey
■ Escalation rate—Specifies the number of bot sessions that were escalated to a human representative
■ Abandon rate—Specifies the number of bot sessions that were engaged but not resolved or escalated
■ CSAT—Displays the results of the customer satisfaction survey the bot provides to willing users at the end of the conversation
Monitor chatbot performance
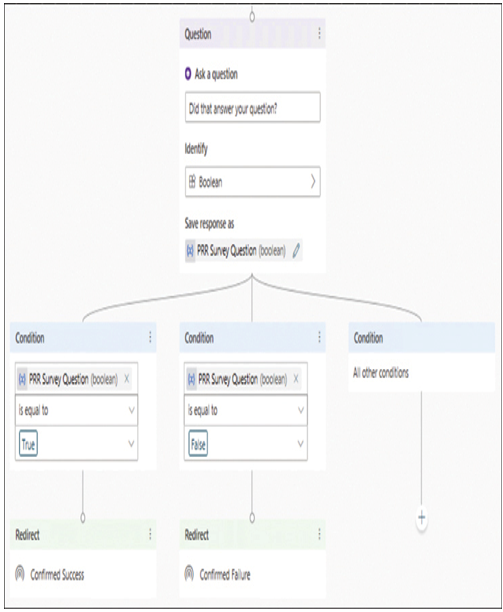
Power Virtual Agents includes a prebuilt End of Conversation topic, shown in Figure 6-25, which includes a survey question that allows users to state whether their session with the bot was successful in answering their questions or solving their problems. This is one way to monitor the performance of a chatbot in terms of customer satisfaction.

FIGURE 6-25 The End of Conversation prebuilt topic in Power Virtual Agents
The Analytics page includes charts that track the customer survey results generated by the End of Conversation topic, as well as the other possible session outcomes:
■ Engagement—A session in which the customer supplies a trigger phrase that launches a user-created topic (as opposed to one of the system topics, such as Greeting) or the session ends with the escalation of the issue to a human representative. An engaged session must always be resolved, escalated, or abandoned.
■ Resolution—An engaged session in which the user responds to the End of Conversation customer satisfaction survey with Yes or with no answer.
■ Escalation—An engaged session in which the bot transfers the issue to a human representative.
■ Abandonment—An engaged session that, after one hour elapses, is not resolved or escalated.
Some of the more detailed charts included on the Analytics page are as follows:
■ Session outcomes over time—A line chart that tracks the daily number of resolved, escalated, and abandoned sessions on separate colored lines.
■ Engagement over time—A column chart that specifies the daily number of engaged and unengaged sessions.
■ Rate drivers—Three tables that lists the topics with the greatest impact on the bot’s resolution, escalation, and abandonment rates. In each table, the Rate figure is the percentage of engaged sessions, including the specified topics that have a Resolved, Escalated, or Abandoned outcome. Impact is a bar representing the resolution, escalation, or abandonment rate of sessions, including the specified topic minus the rate of sessions that do not include the topic. A red bar indicates a greater-than-average resolution, escalation, or abandonment rate; a blue bar indicates a less-than-average rate.

